Archive for the ‘Corporate Growth’ Category

How to avoid using tax payers’ money and maintain optimum capital structure to maximize shareholders value?

June 2, 2011

Every organization or banks main aim or motto is to maximize shareholders value. However shareholders were always concern about financial distress situation where they have to dilute their share to pay debt holders or govt. need to step in and use taxpayers’ money to bail out banks/institutions.

We have faced these kind of similar situation during 2008 financial crisis where billion of $ i.e. tax payers money were used to bail out several banks. How to undo this kind of financial distress situation & avoid using tax payers’ money? One answer to this question is adding contingent capital (coco bonds) in capital structure.

What is contingent capital? Contingent capital is a debt that converts automatically to equity after some triggering event like decline in the market value of equity or capital below threshold limit. Contingent capital is likely to play a very important role in new BASEL III agreement. As per estimate banks need to issue $ 1 trillion of contingent capital to replace existing security that no longer qualified as regulatory capital.

However generally contingent capital (coco bonds) are tied with certain regulatory ratio like capital ratio (core Tier 1 capital), once the banks breaches the ratio then the debt automatically gets converted into equity to avoid financial distress situation. However problem with this concept is that it is regulatory based not market based and it transfers wealth from shareholders to bondholders and kills the main motto maximizing shareholders value (Creating value for shareholders means creating value for all the stakeholders) as conversion takes place at predefined price or at current market rate.

Capital ratios are calculated on quarterly basis and doesn’t provide true market impact of current situation & can’t handle market manipulation properly.

 Mean & Median (Core Tier-1 Ratio in 2008) of 50 major banks (%) 

March 31

June 30

Sept. 30

Dec. 31

Mean

8.07

8.14

8.16

9.12

Median

7.88

7.92

7.89

9.14

By comparing September 30 ratio with March 31 and June 30 ratio we can hardly make out occurrence of any financial distress situation but market reality was totally different as we saw during the crisis.

COCO bond seems ideal instrument to maximize shareholders value however they are not. In February 2011 Credit Suisse issued a coco bond that gets converted into equity whenever bank’s core tier 1 capital falls below 7%. However regulator can also force conversion if it sees that credit Suisse will need public fund to avoid insolvency. The conversion price was fixed at minimum of $ 20. As per these characteristics this bond seems risky.

First, trigger is based on capital ratio which is an accounting number therefore will be different from the market based measure of financial leverage, especially during financial crisis. Hence, there is no way to predict stock price at the time of conversion.

Second, if the stock price at the time of conversion is less than $ 20 then bondholders will incur significant loss.

Third, the possibility that regulators can force conversion before the trigger is reached creates an additional risk which is difficult to price. Though the bond was successful among retail investor but its base was very limited due to its riskiness.

Better contingent capital should be linked to current market situation and triggers are based on current stock price / market value of asset.

Generally market based trigger are criticized as they create instability. Bondholders has incentive to short sell shares to trigger conversion and at the same time fear of huge dilution makes shareholders sell their share and create death-spiral for a company.

What’s the challenge?

Main challenge in issuing these kinds of debt instrument is that instruments should carry minimum risk so that it can be catered to mass risk-averse investors and simultaneously protecting the motto of maximizing shareholders value. In normal convertible bonds wealth gets transferred from equity holders to debt holders. Shareholders don’t prefer these instruments in company’s capital structure.

What will be the ideal instrument that avoid share dilution, protect the money of contingent bondholders and handle market manipulation or panic perfectly?

CALL OPTION MARKET TRIGGER CONVERTIBLE (COMTC) BOND can be ideal contingent bond that can be issued above 20-30 basis point of risk-free bond and caters to mass risk-averse investors who know they will be paid at the time of financial distress situation.

How does COMTC works?  

COMTC bonds target to risk-averse investors and provides return above normal risk free bond. This instrument carry forced right to get paid at the time of financial distress situation. It carries a conversion trigger point which is less than then current market price. However in order to avoid market manipulation & panic shareholders got pre-emptive rights to buy-back shares from bondholders so that they can avoid any conversion that results from market manipulation or panic. At the same time in order to avoid huge dilution shareholders got the right to issue share (right issue) at the same conversion price and pay back the bondholders and maintain proper capital structure.  As bondholders will be paid back they have no incentive to hedge their investment by shorting the stock when the leverage ratio approaches the trigger point.

Why conversion trigger price is lower to current market price?

Conversion price of COMTC bond should be less than the trigger price. Suppose the market price of $ 10 share will come down to $ 5 during financial distress situation. In this case conversion price of the bond should be fixed at below trigger price say $ 1. We can understand this with an example.

Example:      Senior Debt    –     $ 1000

Equity Capital –   $ 10*7 = $ 70 (7 share with face value of $ 10)

COMTC          –        $ 30

Scenario 1    (Financial Distress Situation) = Market Price $ 5

Conversion Price = $ 5 (Conversion price = Market Price)

New diluted Share price = (6*5+7*5)/13 or (30+35)/13 or 65/13 = $ 5 per share

(Assume that repayment will be made after conversion)

Total Value of Assets = 1000+65 = $ 1065

Shareholders will exercise his option of right issue & pay back bondholder at its par value till the time value of assets is $ 1065. If value goes below $ 1065 shareholders will not exercise his call option and all the value above $ 1000 will be shared between bondholders & shareholders at the time financial distress or bankruptcy.

Scenario 2    (Financial Distress Situation) = Market Price $ 5

Conversion Price = $ 1

New diluted Share price = (7*5+30*1)/ (7+30) or (35+30)/37 or 65/37 = $ 1.76 per share (Assume that repayment will be made after conversion)

Total Value of Assets = 1000+65 = $ 1065

Shareholders will exercise his option of right issue & pay back bondholder till the time value of assets is $ 1037 or market value of share is $1. If the market value goes below $1 or total assets value becomes less than 1037 shareholders will not exercise his call option and all the value above $ 1000 will be shared between bondholders & shareholders.

Thus with $ 1 conversion price, bondholders become shareholder when value falls below $ 1037. With $ 5 conversion they become shareholders when value falls below $ 1065. Lower conversion price clearly reduces riskiness of convertible debt which lowers financial distress and makes the security more marketable among fixed income investor.

How COMTC bonds are different from COCO bonds?

COMTC BONDS

COCO BONDS

COMTC bonds are market triggered bonds that provides true financial leverage Normally COCO bonds are regulatory triggered bond i.e. capital ratio. Such mechanism are accounting measure and  doesn’t work when company’s capital structure deteriorate rapidly
Regulators can’t intervene as it is totally market based Regulators are aware that capital ratios are stale, they may be tempted to intervene and pull the trigger themselves and this regulatory risk may difficult to asses, even for major credit rating agency.
COMTC bonds are risk-averse bond, it can easily marketable & cater to mass market. COCO bonds are difficult to market as investors know that capital ratio doesn’t provide true picture so in order to mitigate risk they demand higher spread however issuer thinks firms financial distress risk is lower and reluctant to pay higher risk premium.

Conclusion

COMTC bonds are risk-averse bond that can be targeted to mass market as it provides assurance that bondholders will be paid at the time of financial distress. These are market related bonds triggered at certain market price or market value of assets. It considers current financial leverage and provides absence of regulatory intervention. All the normal bonds carry tax deductible interest rate and in order to make COMTC bonds attractive it should also be tax deductible. These bonds can be issued by any institutions apart from bank to prevent financial distress situation and maintain optimal capital structure.

COMTC bonds are superior to COCO bonds and one of the best debt instruments to be part of organizations/banks capital structure.
Take Me To The Home Page

Shareholders Value Creation

January 6, 2011

How to create value for your organization? Why TSR (Total Shareholders Return) is the best metric for value creation? Why is it difficult to create sustainable value? How to build sustainable value creation strategy? Why CSR & brand value change not consider as a part of TSR? Why multiple compressions are so difficult to beat? Why investors & analyst discounts valuation multiple? How to transit majority investors without eroding TSR? How to create value in low growth economy? How to play your strategy with sustainable TSR matrix as per investors eye? Why investors communication is so important for value creation? Which strategy you should use for value creation? How to use value creation scenarios? Why cash strategy is so important in low growth economy?

If all these questions bother you before developing your company’s corporate strategy/value creation strategy then you must see New Year’s complimentary presentation

Shareholders Value Creation – “A handy e-book on how to create sustainable shareholders value”

Take Me To The Home Page

Granular Business Portfolio Matrix

November 24, 2010

GE developed 9-box matrix strategy to manage portfolio of business when business grows to more than 150 business units.

In today’s global environment where world is flat, global economy, workforce & businesses are integrated, boundaries are narrowed traditional 9-box matrix is not very useful for managing portfolio of business. It requires more granular approach towards business portfolio.

This presentation is an advanced version of “traditional matrix (9-box) business portfolio strategy”.

Manage business portfolio in new multi-power economy with (2-way 9-box) matrix strategy

Organization Vision & Corporate Strategy

November 19, 2010

Every organization has a vision & in order to achieve that vision organization develops corporate strategy.

How to develop an optimal corporate strategy that carries both Blue Ocean & Red Ocean products?

Organization Vision & Corporate Strategy

Take Me To The Home Page

Strategy Control Map (Market Capitalization Dynamics)

October 8, 2010

Strategic Control Map (Matrix) is based on market capitalization dynamics to help companies identify their biggest opportunities and threats and boost their odds of hunting for acquisition targets rather than being hunted themselves.

Please follow the below mentioned link to see 1 slide presentation on my slideshare account.

Strategy Control Map Matrix

Take Me To The Home Page

Shareholders Value Creation through Price Optimization (SVC-4)

September 2, 2010

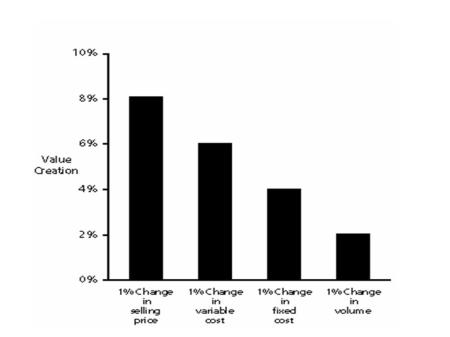
Does your organization create appropriate value with Pricing Policy? Normally organization doesn’t give as importance to pricing as to Volume growth & Cost optimization however reality is that Price optimization creates more value than Volume growth & cost optimization.


 # Research by one of the top Consulting Firm

Irony is that price optimization is overlooked as key business driver though for many businesses price optimization plays major driver of growth than volume or cost optimization.

Now the question arises why haven’t more organizations use price optimization for value creation. Following are the challenges for not adopting price optimization-

  • Belief that price is driven by external forces: Many businesses mistakenly believe that they must passively accept prices across all products, markets and channels 
  • Sales force resistance: This is particularly the case when people are rewarded on the basis of sales volume 
  • Information collection: Difficulty obtaining the necessary information from existing systems is a reason why companies may ignore potential value from price optimization
  • Perceived complexity: It generally requires thoughtful manipulation, often at the level of individual transaction

Management’s challenge is to achieve optimum price in the existing market. Normally following approaches are dominated the pricing strategy-

Cost Plus: It has an advantage of simplicity in implementation & administration however there is a high risk of leaving value on the table if some customers are prepared to pay higher price

Customer Value: Pricing according to the customer value approach involves setting prices to capture the full value customers place on a product or service. The advantage of this approach versus cost plus pricing is higher profit margins can be achieved through the capture of the customer surplus. However the main drawbacks are complexities involved in implementation – how to determine customer utility for each product line and how to account for difference in the price a customer is ready to pay

Penetration Pricing: Pricing low to gain market share in anticipation of scale or experienced economies however with product lifecycles becoming shorter and shorter, the risk inherent in penetration pricing is that the product may not endure long enough to deliver the expected savings

Skimming:  A skimming strategy is essentially the opposite of penetration pricing — pricing high to maximize margin from customers ready to pay the most however success of skimming strategy depends on the ease of entry by competition, since high margins are an open invitation to new entrants

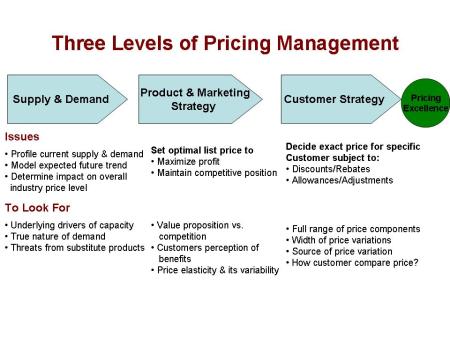
Company’s pricing strategy depends upon market position, stage of product life cycle & customer demand however pricing choice should be driven my marketing strategy & to maximize shareholders valueSupply & Demand

How will current and future supply, demand, and cost dynamics affect the overall industry price levels in the foreseeable future? Although managers are often well versed in monitoring demand drivers and attuned to responding to the threat of new entrants, market and customer strategies are typically less effectively managed. Therefore for many companies these last two hold the greatest potential for where additional value can be captured.

 Product & Marketing Strategy

The key issue in product and market strategy is determining the “list price,” the seller’s published price for a service, product line or SKU. The Stock Keeping Unit (SKU) is the level at which price optimization is most powerful, since customer price sensitivity can frequently be found to vary according to the colors, dimension or other variations in the characteristics of a product.

The psychology of list prices is an important factor, since the price acts as a reference point for customers and conveys a range of signals about the product. The list price must be set at a point that preserves a product’s price / benefit advantage in the eyes of customers while maximizing profitability.

The list price is generally the base against which discounts and allowances are taken. Therefore, it needs to be high enough to offset the expected discounts, freight recoveries and so on. A higher list price allows managers a greater degree of freedom in terms of offering a range of customer discounts. However, a list price too high may push the product into an inappropriately elevated price bracket in the eyes of customers.

Optimizing list price is easily grasped in principle, but in practice it is often ignored or not successfully implemented. Managers can identify the potential opportunities for value creation when they develop an improved understanding of the forces influencing achievable list prices. This requires investigation of factors such as: 

• Margin bands

• Regional variations in margin

• Freight rates

• Pricing conventions in the industry (early payment discounts)

• Distribution channels

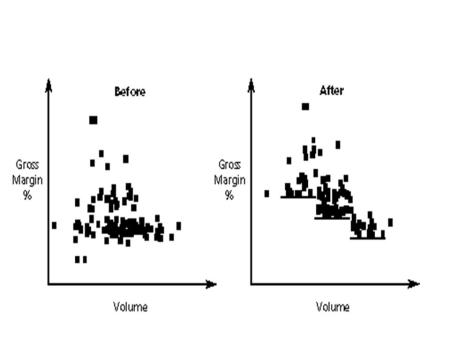
Analysis of price sensitivity often reveals that the optimal list price can vary among geographic markets, products bundles or product lines within a category. Each of these areas represents an opportunity to enhance margins.

 Figure: A

 Figure A reveals that client was able to identify margin bands based on customer purchase volumes of a fast moving consumer product and to implement a new list price structure with the potential to add significantly to the value of the company.

The principal outcomes and benefits companies obtain through product and market price optimization strategies are:

• A restructured list price program that reflects the varying competitive intensity that enables the seller to capture more of the customer surplus

• Identification of opportunities to increase value through price differentiation between segments.

 Figure: B

Figure B shows the magnitude of margin increases available on low volume items in one market for fabricated products. Higher list prices were possible in this case due to a combination of lower customer price sensitivity on slow moving items purchased only infrequently and less intense competition in the supply of many low volume products. Previously, this manufacturer had maintained a standard margin as its pricing policy across all SKUs for each type of product. Analysis of price sensitivity revealed that while intense competition on high volume SKUs (D & E) required company to “meet the market” on price margins could be dramatically improved on low volume lines. This was because competition on low volume SKUs was typically less intense and infrequent purchases by customers made them less sensitive to the price. Higher margins on low volume SKUs produced a significantly higher contribution and helped ensure that the company could remain competitive on high volume products.

This example illustrates how a better understanding of relative price sensitivity of customers enables a more sophisticated approach to list prices, and can result in significant potential for value creation.

Customer Strategy

The key to customer pricing is maintaining loyalty while achieving the highest prices possible that are appropriate to the volumes sold to the customer. It’s a delicate balance and is based largely on the psychology of discounting.

In many companies, senior management’s understanding of price variation at the customer level is poor with the actual price ultimately determined by the sales force. Management needs to carefully monitor and evaluate customer pricing. Without an appropriate pricing framework, specific discount schedules and aligned performance incentives, sales staff with too much autonomy can quickly erode company profits and even provoke competitive responses that destroy value through out the market.

The key issue is identifying and managing the factors that have the potential to erode list price. These include:

• Discount schedules

• Rebates

• Volume bonuses

• Promotional bonuses

• Cooperative advertising/marketing

• Allowances

• Payment terms

• Buybacks

Performing a transaction level analysis can be a powerful tool for value creation, enabling managers to tighten the relationship between volume and price. In particular, it helps companies increase the contribution from low volume customers that may have obtained discounts or favorable terms that are otherwise reserved for high volume purchaser. Transaction level analysis also allows managers to directly assess:

• The value of customer segments and accounts, therefore determining the appropriate allocation of sales effort

• The net effect on profit of discounts, bonuses and other incentives given to particular sales channels

One indirect benefit is the increased price discipline in the overall market that results form a rational and consistent approach by key players, thus reducing the risk of irrational competition destroying margins for all. Another application of a rational pricing strategy is to examine price differential between small and large companies. Often, small customer accounts can occupy a disproportional amount of sales force time and provide relatively small returns for effort.

Pricing Frameworks to Improve Shareholders Value

Managers are under increasing pressure to lift returns and to focus on improving shareholder value. Institutional investors are becoming increasingly vocal in demanding cost reductions and rationalization programs however they should devote extra attention to the revenue side and the potential for price optimization. A robust pricing framework has the potential to improve shareholders value through:

• Establishing and maintaining list prices that effectively balance profit maximization with product positioning

• Preventing erosion of prices at the customer level through a careful customer pricing and discount strategy.

Senior managers therefore need to regularly assess pricing policy and administration. Key questions to consider:

• Does the company pricing policy recognize differences in regional market dynamics? 

• Is pricing segmented to recognize the variations in perceived value among different customer groups? 

• Is there a transparent discount policy based on customer relationship value? 

• Who has discretion to modify prices? What criteria are required? 

If an organization can acknowledge the importance of price as a driver of shareholders value, part of the battle is won. Once managers and sales people incorporate this awareness price into their everyday monitoring of performance, the company will start to create long-term value for its shareholders.

Take Me To The Home Page

Optimal Finance Strategy for Shareholders Value Creation (SVC-3)

August 25, 2010

Financial Strategy- utilization of capital, sources of funds & distribution to shareholders have significant impact on value creation.

Does your organization use optimal Financial Strategy for value creation? Normally organization gives more emphasis on operational strategy to improve operational efficiencies and altogether ignore systematic approach towards Financial Strategy. In order to fulfill shareholders expectation & value creation organization needs to properly align Operational & Financial Strategy.

In order to develop optimal Financial Strategy organization needs to develop Financial Strategy framework for sources & uses of fund.

There are 3 steps that need to be followed to develop optimal Financial Strategy-

  • Establish an appropriate Capital Structure
  • Understand whether the organization is undervalued or overvalued in the market
  • Develop a Financial Strateg

Establish an Appropriate Capital Structure

Capital structure is often viewed as a minefield of finance theory. Because of this, many executives default to the status quo that, given changing circumstances over time, rarely results in full value creation. An important key to solving the capital structure puzzle is remembering that equity funds (even for private companies) are not free – in fact, they are very expensive. While there is not a contractual obligation to pay shareholders in the same manner as there is for debt holders, there is a very real opportunity cost inherent in equity funds. The cost of equity is high because shareholders bear the systematic risks of being in a particular industry and will suffer the most in a bankruptcy. In comparison, debt financing is less costly because, being subject to contractual obligations – paying interest and repaying principal – debt holders exchange more certainty for a lower expected yield. Additionally, debt is in a preferred position in a bankruptcy and is tax deductible, further reducing its cost to the company. While this favors using leverage, doing so increases financial risk, the cost of debt, and the cost of equity. How do these and other factors interact to determine an appropriate capital structure for a company?

One of the organizations suffering from excess cash availability & undervaluation by market uses the following strategy to develop appropriate capital structure–

Downside cash flow scenario modeling – A capital structure is derived from a set of downside cash flow scenario forecasts. This yields a capital structure that can withstand the shocks of the downside scenarios.

Peer group analyses – Peers’ current capital structures and trends are analyzed for insights into operating characteristics that might indicate the ability to support more or less debt.

Bond rating analysis – The debt capacity within given debt ratings is assessed.

Establishing base case and downside scenario cash flows changes the exercise from a theoretical discussion to an intuitive one because it permits the inclusion of risks, management preferences, and cash flows into the decision.

To understand the magnitude and volatility of cash available for debt service, the first step is to build a base case cash flow forecast for the next three to five years. Collaborating with management, a number of key risks were identified and quantified to develop a series of downside cash flow scenarios. In each scenario, decisions were made about the level of capital investment that would be made and whether the dividend should be changed in order to work from a realistic set of forecasts.

With the downside cash flow scenarios quantified, the next steps were to:

  • Identify repayment terms for debt that were realistic in a downside scenario.
  • Value the potential for making acquisitions and keeping some “dry powder.”
  • Discuss with management the safety margin that would appropriately balance shareholder value with the risks in the business.
  • Calculate the amount of debt that met the cash flow constraints and made full utilization of the interest tax shield.

Understand whether the organization is undervalued or overvalued in the market

By comparing investors’ expectations of performance of a company’s value drivers – sales growth, operating profit margins, cash tax rate, incremental fixed and working capital investment to management’s expectations, it is possible to pinpoint the areas where they differ and investigate how they can be addressed, what are investors expectation. Once differences in investors & management’s expectation identified then the next step is to bridge the valuation gap.

Taking the same example, The organization suffering from undervaluation & excess cash availability observes that there are no major investment opportunity available and company is under levered and can generate debt at choice in future, if required urgently, investors expects that the company should return excess cash to investors.

In order to find out how much money company should return to investors & by which means money should be returned e.g. Nominal Dividend, Special Dividend, Share repurchase etc. organization need to develop Financial Strategy Framework.

Develop Financial Strategy

Scenario developed from capital structure serves as a basis for quantifying the amount of excess cash expected to generate from the business.

Definition of Excess Cash

Net Income

+ Depreciation & Amortization

+ Difference between Book Tax and Cash Tax

Incremental Working Capital

Capital Expenditures

Acquisitions

Dividends

+ Proceeds from Exercise of Options

= Excess Cash

In the normal circumstances organization return excess cash by paying debt however in the above mentioned example organization is already under levered so excess cash need to be return to shareholders and share repurchase option ideally suited due to following-

  • Creates value for remaining share holders as the stock is undervalued.
  • Signals to the market that the stock is undervalued, helping to raise the stock price closer to management’s valuation.
  • Returns cash to the shareholders who want to sell their stock, thereby not imposing a possible taxable event on those who do not want one, as would be the case with a dividend.
  • Provides flexibility to distribute cash as fits the company’s circumstances.
  • Can return larger amounts of cash to shareholders than an increase in regular dividends.

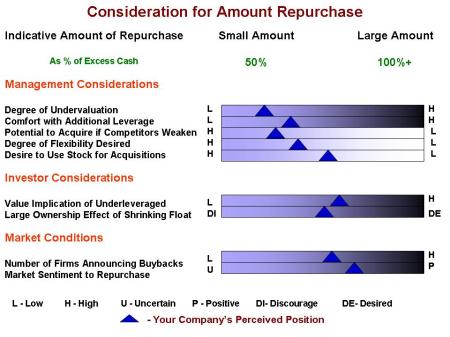
Management and Investors consideration along with market condition should be considered before finalizing amount of repurchase.

 Conclusion

Boards of Directors and management that are sharply focused on maximizing the value of the firm will recognize the importance of reviewing and adjusting their financial strategy just as rigorously and frequently as their operating strategy. The latter supports the former, but many companies stop after having addressed only their operating strategies, leaving on the table the opportunity to create even more value.

Communicating both internally within the company and externally to investors can help refine a financial strategy and possibly avoid costly missteps. Creating a common framework within Board could discuss financial strategy in a holistic manner proved to be constructive and avoided endless debates. While financial strategy is just part of a broad arsenal of tools available to enhance shareholder value, it is an important one because it provides a number of levers that can be fine tuned on a regular basis. Its effectiveness relies on management teams and Boards willingness to evaluate and adjust those levers as frequently as they do those of their operating strategies.

Take Me To The Home Page

Shareholders Value Creation through Strategic Market Positioning (SVC-2)

August 17, 2010

What is market share? Does market share mean share of product, share of category, share of channel, share of customer, share of region or share of something else? How does your company define market share? Companies that cannot answer this very important question cannot effectively engage in Strategic Market Positioning (SMP) and in the long term, will find it difficult to invest successfully for growth.

What is Strategic Market Positioning (SMP)? For a business or product line that competes in only one strategic segment, SMP is simply the market share of the business in its strategic market segment. For a company competing in multiple strategic segments, its overall SMP is the average of its SMPs in each strategic segment, weighted by the business’s sales or investment in each strategic segment.

Achieving effective SMP involves analyzing an industry to determine strategic market segments and then making investments in those segments that will lead to increased returns.

Does SMP = Market Segmentation? Normally market positioning is considered as market segmentation. This is totally a marketing technique that involves breaking down market into smaller segments in order to better understand consumer behavior & identify opportunities to increase overall market share.

However on the other hand SMP is different because it creates shareholders return. It brings together the disciplines of strategy and finance to help shape a company’s approach to value creation. Organizations that fail to differentiate between market segmentation and Strategic Market Position may be at risk because the definition of market share often does not correlate with company profitability, returns and strategic potential.

Do you think larger market share provides superior return? As per research by one of the top consulting, larger market share even provides low return in comparison to companies having smaller market share with Strategic Market Positioning. There are several reasons supporting to this finding. The smaller, more profitable company may avoid going head-to-head with larger, more powerful competitors. It may deploy its investments into segments where (among other things) the dominant players simply do not compete. In essence, it positions itself in its industry strategically and allocates more assets in fewer, carefully selected ways. As a result, it has a much higher market share in its chosen segments.

How to create Value through Strategic Market Positioning (SMP)

Following 3 approaches should be followed to create value through SMP-

Be Creative & think Broad: To maximize the chances of identifying successful strategies, think beyond the current business offerings. Apply the Blue Ocean Strategy principle “Reconstruct Market Boundaries” & “Reaching Beyond Existing Demand”. Evaluate other businesses that share the same customers or leverage the same technologies. Consider services as well as product offerings. Identify the range of organic or acquisition initiatives that could be used to pursue potential growth strategies.

Conduct SMP Test: Identify the growth strategies that have the greatest potential to increase the company’s weighted average relative market share, as measured across all strategic segments impacted by the strategy. This will identify strategies that have the potential to improve the company’s overall position on the most important drivers of profitability. Conduct SMP test quantitatively to specific initiatives to see whether market share, appropriately defined, increases or decreases.

Conduct Value Creation Test: “Strategic value” is defined as the net present value of cash flows from higher revenues, lower costs and lower capital requirements that will accrue from the growth opportunity and the existing business being run together versus separately.

We will see an example of Southwest Airline & America West Airline to know how SMP creates higher value.

Southwest Airline & America West Airline started in roughly the same position, but ended in very different places. Both formed as low-cost, low-fare regional carriers, both airlines grew their operations and profits on roughly parallel tracks through the early 1990s.

America West followed a traditional hub-and-spoke design for its flights and became well known for its expansionist strategy. Southwest, on the other hand, grew at a slower pace, taking the time to build up strong positions in specific markets before penetrating additional markets. Southwest’s emerging strategy was creative in that it focused on short haul, high frequency flights in city pairs where the airline could secure a strong market share position, often flying to a secondary, lower-cost airport. In addition, its costs were controlled as a result of the corporate decision to use (and therefore maintain) only one type of aircraft: the Boeing 737.

By contrast, America West’s expansionist strategy called for international routes, which in turn called for a heterogeneous and expensive-to maintain fleet. America West did not base its strategy on the core tenet of SMP: build the type of market share that maximizes high-impact growth and leverages economies to the greatest extent possible.

  Summarize two Airlines positions & Strategies

Summary Stats ( 1990) South West American West
Revenue $1186 M $ 1315 M
Number of Aircraft 106 104
Types of Aircraft 1 4
Flight Design Point-to-Point Short Haul Hub & Spoke

Figure 1: Compares the two airlines in terms of traditional market share and Strategic Market Position to reveal the true impact of their different strategies

 Source: Bloomberg 

Although America West and Southwest had similar US total market shares in 1990, this measure obscures their relative competitive strengths.

In the airline business, pricing power and operating costs are driven more by share of flights between states or, more precisely, by share of flights between specific city pairs. Travelers prefer to fly an airline that has several daily flights between two points because it gives them more flexibility in the event of a missed or delayed flight. This is better for airlines because they are likely to have larger scale and more efficient operations at each end.

Southwest Airlines recognized this as a critical factor and was careful to enter a new market only when it felt it could achieve substantial strategic share in that market. By contrast, America West assumed that, by entering larger and increasingly international markets, it was strengthening its overall position in the airline market. In fact, it was neglecting its core franchise and spending limited resources to enter new market segments where it had little to offer against strong competitors.

Figure: 2 illustrates the value creation outcome of these two Airlines while adopting different strategies

As America West’s emergence from Chapter 11 in 1994, its stock has declined at a CAGR of -4.9 percent, while Southwest’s stock has grown at a CAGR of 9.9 percent.

Conclusion

Strategic Market Positioning (SMP) is a proven and highly effective tool for creating value. It is founded on the assumption that not all growth is good – in fact, that some growth actually destroys value. SMP helps companies identify the difference and respond accordingly. By being creative and thinking broad to maximize the chances of identifying successful strategies, and by conducting the SMP and value-creation tests, an organization’s leadership can gain valuable insight into organic growth ,acquisitions and other growth investments and be better able to formulate strategies that have the potential to improve the company’s overall performance.

Take Me To The Home Page

Shareholders Value Creation through International Expansion (SVC-1)

August 12, 2010

Do you think International Expansion always creates shareholder value for an organization? Not all international expansion creates value, international expansion considered by identifying and evaluating geography/country with target market segment creates value for shareholders.

Why does organization go for international expansion? There are 3 reasons for organizations to go for international expansion-

  • Improvement in cost-effectiveness of operations
  • Expansion into new markets for new customers
  • Following global customers

Companies looking for growth through new markets and customers, particularly those with limited international exposure, should begin with a prioritization of countries to determine where resources should be spent. Even if a country has already been identified as a high priority, understanding the relative attractiveness of other countries is valuable for decision making.

Planning for International Expansion

A growing or untapped market holds an understandable attraction. But every country must be scrutinized under the lens of a company’s value proposition before expansion is considered. For US/European companies, entering large rapidly emerging markets such as China/India may seem to be an easy decision but in fact there may be a market closer to home that provides stronger returns, has less strategic complexity, and requires fewer costly adjustments to business processes. The focus of the analysis should not be: “Should we expand into China, India?” but rather: “Should we expand into another country, and if so which one?”

Business Planning for International Expansion includes three phases:

  1. Country Prioritization
  2. International Market Due Diligence
  3. Acquisition & Partnership Development

 Country Prioritization

Normally organization relies on typical indicators such as per capita income, total industry market size, or geographic proximity to identify a country but sometimes it can be misleading. Instead, a systematic screening process should be followed to bring the best options. The screening should cover three factors HARD CRITERIA, SOFT CRITERIA & CORPORATE FIT.International Market Due-Diligence

Phase one identifies one or more geographic markets that appear desirable but requires more detailed assessment. In Phase two i.e. Market Due-Diligence determines the expected value the proposed expansion might generate. This valuation is based on a forecast of revenues, an evaluation of costs and investments, and the application of a risk-appropriate discount rate. Typically, revenue forecasting is the most challenging component and is usually more complex in an unfamiliar market and those undergoing rapid changes in the competitive landscape and/or regulatory environment.

Revenue forecasts based on objective and detailed analysis are the tools for rational investment and expansion decision making. In forecasting product revenues, key steps include:

Determining the total customer base or market size – A range of factors including geography, price point, technological capability and end user group can define markets.

Segmenting the market to identify what portion should be targeted by the product or service – In a developing economy, the segmentation is typically identified by price point or income level of potential customers

Expected penetration of the product or service into the market segment

Expected price per unit

Acquisition & Partnership Development

International expansion is often combined with acquisition or a strategic partnership as a vehicle for entering in a country. Not all acquisition or partnership creates value. Partnership creates value if they provide-

  • Access to valuable or scarce resources or raw materials
  • Privileged market position
  • Access to transportation or distribution systems
  • Access to specific markets or customers
  • Valuable brand recognition or identification

 What kind of Partner is appropriate?

Many companies still select their local partners reactively, based on deals being brought to them rather than through a systematic screening process, and they end up with a sub-optimal partner. It is necessary to first outline the specific criteria and benefits you are looking for and then identifying a range of companies that could provide those benefits.

 Conclusion

The principal cause of failures in international expansion has been commercial misjudgment. A number of high-profile brewing joint ventures failed when they overestimated China’s thirst for more expensive, international brand beer. When entering any new geography, the odds of success can be improved significantly if the company conducts more due diligence, identifies realistic market demand, and “tests the waters” prior to an aggressive expansion effort. Gathering locally generated information is time consuming, but it is much less costly than changing direction once an investment has been made.

Take Me To The Home Page

How Divestiture helps in restructuring corporate portfolio of business?

July 6, 2010

In order to achieve growth organizations give more importance to Merger & Acquisition. Merger & Acquisition plays pivotal role in organizations Corporate Strategy & maintaining portfolio of business to achieve high return on capital & growth. However situation arises once organization diversify itself into various businesses and its corporate portfolio becomes so huge that it is very difficult to maximize return on capital & take advantage of new growth opportunities.

Divestitures and carve-out plays a very important role in restructuring organizations corporate portfolio to maximize return & growth.

Normally organization doesn’t give as much importance to divestitures as to M & A however if Divestiture/Carve-out activity carried out timely & sequencely then it can provide huge benefit in terms of shareholders value, future growth and cash flow.

Why organizations do Divestiture

The reasons to divest a business are wide-ranging, from short-term cash generation to a desire to restructure the business portfolio by spinning off non-core or low-performing assets. And regardless of the driving force behind a divestiture, the overall objective of most companies is to get the best possible return—i.e., the highest price.

In order to get optimum return from divestiture organizations should do it in an accelerated time frame. Best practice is to make sure that to-be-divested units are configured for maximum appeal to potential buyer, and putting effective program management in place to manage the complexity of divestiture.

Divestiture Strategy

In order to develop its divestiture strategy, a company should comprehensively assess its corporate portfolio to identify opportunities for value creation. This entails four basic steps:

  • Aligning assets with the business’ best opportunities
  • Developing a timing and sequencing strategy for separation & divestiture  transaction
  • Define boundaries of assets being considered for divestiture
  • Packaging the divestiture assets for maximum value

Aligning assets with the business’ best opportunities

Organization should carefully study the overall business’ growth opportunities, and the capital required for each business in the portfolio to take advantage of those opportunities. This perspective then must be paired with an understanding of the potential value of each business to an external owner compared to its worth to the divesting company.

Timing & Sequencing Strategy

Parent company should determine the most advantageous timing  & sequencing strategy for the divestiture and its execution. In most instances, it is best to start with carving-out of a business unit before the sale process. Following are the benefits of carve-out.

     Transparency

Potential buyers require full transparency of an asset’s tangible and intangible value, contracts, service relationships and, of course, revenues and costs. Transparency will be easier to achieve if the divestiture target is a separate legal or organizational entity (which includes having its own accounting systems and boundaries).

      Avoid Uncovering Bad News

The second reason to begin the carve-out process early is that having a concrete and defined divestiture target helps to avoid uncovering any bad news during the sale process that would be an obstacle to negotiations with potential buyers. Furthermore, having already executed the carving out of the asset to be sold enables the selling company to quickly capitalize on emerging sales opportunities—such as a sudden recovery of M&A markets or the appearance of an unexpected potential buyer.

Define Boundaries of Divestiture Target

Once the timing and sequencing of the divestiture are determined, a company must carefully define the boundaries of the divestiture target, taking into consideration the strategic fit of the business unit as a whole and its constituent parts within the parent company. For example, one business function of a to-be-divested business unit might provide research services to the rest of the parent company, or possess valuable technical knowledge.

In addition, the future intended scope of the parent business after the divestiture should be considered to ensure potentially valuable assets are not jettisoned.

Packaging the divestiture assets for maximum value

The final step is to make the divestment target as attractive as possible to the most likely acquirers. Stopping at the prior step and focusing strictly on the to-be-divested business unit’s boundaries from an internal viewpoint likely would not result in the most attractive asset from a buyer’s perspective. For example, some investors desire complete, operationally functioning entities.

To facilitate a transaction the divesting company would need to provide a unit meeting that description from the buyer’s perspective and further adjust the boundaries of the to-be-divested organization if needed.

Divestiture Strategy Execution

Once it is clear which assets to divest and how it should be packaged, a number of best practices can help ensure successful execution.

Effective program management should be put in place to avoid underestimating the impact of divestiture on daily business.

Second, a company must plan for the future success of the divestiture target, and make sure accountability between the parent company and the to-be-divested organization is clearly defined.

Finally, it is vital for a divesting company to maintain an open dialogue and stay flexible as the transaction unfolds.

British Petroleum’s master carve-out & divestiture strategy

BP captured $9 billion in cash by divesting its petrochemicals units—up to $2 billion more than Wall Street analysts had expected. In crafting the divestiture program, BP’s corporate development experts defined the major steps needed to separate and sell the $25 billion-a year petrochemicals business. First, the unit was carved out as a standalone business under its own name—Innovene—so it could float on the New York Stock Exchange.

The carve-out, making Innovene the world’s fifth largest petrochemical and polymer company. BP’s dedicated corporate development team determined the key phases, major milestones, work streams and project teams needed to deliver the complex divestment. The whole process involved a detailed assessment of the path to a rapid separation, accelerating the process by two months and greatly enhancing BP’s chances of obtaining the best possible valuation in an IPO. As soon as Innovene was legally a separate entity, the priority turned to IPO preparation, developing the necessary sales presentations for the underwriters and preparing the flotation prospectus. Then the BP team made its move to woo potential buyers, which meant getting ready for the prospective acquirers’ due diligence procedures—a major work stream in it. The multiple options strategy paid off brilliantly, sparking a successful bid from specialty chemicals producer INEOS. The $9 billion deal represented one of the largest-ever leveraged buyouts and instantly made INEOS one of the world’s largest chemical companies. BP had completed a huge divestiture only a year after declaring its intent to sell.

It is generally easier to pursue divestiture in robust economy than during a downturn. Companies should use divestitures to enable much more substantial and long-lasting change. Success in the current economic environment can hinge on effective portfolio rebalancing and efficient divestiture execution. Companies that configure business units for maximum value, manage the complexity, ensure accountability and embrace flexibility throughout the divestiture process improve their likelihood of success. For many companies, there is no better time than the present to pursue divestitures to position themselves for high performance when economic conditions ultimately improve.

Take Me To The Home Page